SEB has chosen a Cloud First strategy based on the Google Cloud Platform. It is a pretty big change for a bank that has been self-sufficient in IT for around 50 years! But how do we track our transition to the Cloud? One way is to measure and work with KPIs or “Key Performance Indicators.
This blog post is based on a presentation by the authors at the Build Stuff Conference November 19, 2021.
Peter Ferdinand Drucker, author of 39 books on the topic of Business Management is credited the quote “If you can't measure it, you can't improve it”. Businesses use KPIs to monitor whatever drives growth. A good KPI is specific, measurable, and makes sense to overall business goals.
We identified and adopted a few principles:
- Agree on a limited set of KPIs. If you have too many, you will risk losing focus and there will be administration that no one cares for!
- Do not build a burden. Automate collection of data and everything else as much as possible
So, if we want to measure our transition to the Cloud, what makes sense for us to measure? Here are some examples of indicators we came up with:
- Ratio between applications deployed to Cloud versus traditional on-premise solutions. Cloud deployments increase and on-premise deployments decrease.
- Usage of managed versus less managed services. Cloud is not about using someone else's computer (it never was your computer anyway). It is about using high-end services at a reduced cost!
- Cost and number of projects and users over time.
- Carbon footprint. Developers and technicians can reduce the carbon footprint by making informed design decisions!
Solution overview
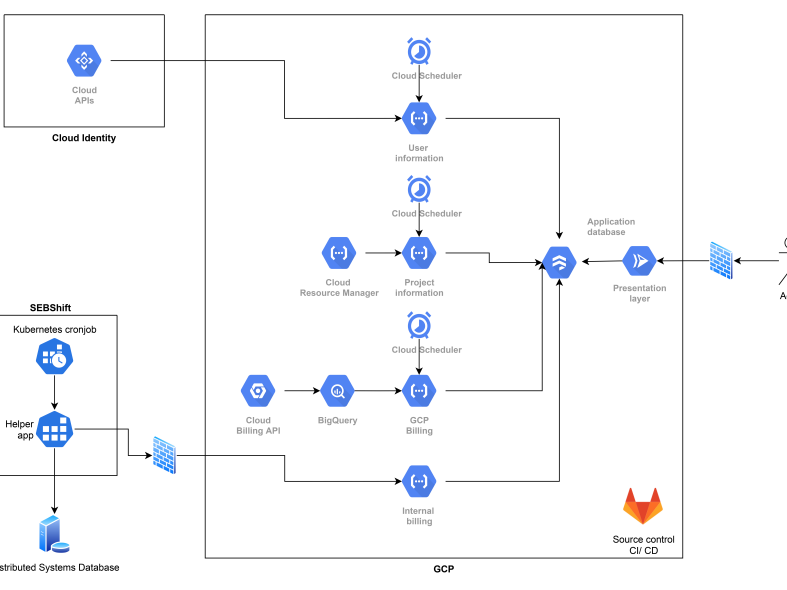
This is the design we came up with for the Cloudification KPI application.
The application consists of four main modules:
- Data sources.
- Data gathering functions.
- Database.
- Data visualization.
The first one consists of the different information sources we employ in the application. Some of them are retrieved directly from the cloud, while others are obtained from on-premise services.
For the cloud-based data, cloud functions are responsible for retrieving and filtering the necessary information from our data sources and storing it in our database in the proper format. Cloud Scheduler is used to schedule these functions to run daily. A different approach is required for on-premises data, as it is not available internally within the cloud. A Kubernetes Cronjob located on-premises is used to retrieve this information and send it to the Google Cloud Platform environment on a daily schedule.
Once all data is available in Google Cloud it is stored into Firestore, a NoSQL database which stores documents in json format. This provides faster and more cost-efficient access than directly querying each of the databases.
Once all the data has been aggregated in Firestore, our web application can retrieve all the necessary data from one location. Data manipulation is done server-side using the Pandas Python library and the frontend visualization is handled by Dash, a backend framework for the Plotly visualization library. We will go into more detail on these later in the article.
It is necessary to highlight that the entire application setup and configuration is done by code; we use Terraform for infrastructure provisioning through a GitLab CI/CD pipeline.
Below, an overview of the application:


