SEB has chosen a Cloud First strategy based on the Google Cloud Platform. It is a pretty big change for a bank that has been self-sufficient in IT for around 50 years! But how do we track our transition to the Cloud? One way is to measure and work with KPIs or “Key Performance Indicators.” This is our second and last blog post about the Cloudification KPI application, where we discuss how we managed and displayed the data we collected in part 1.
Pandas & Plotly Dash
Pandas and Dash are the main tools we use for data manipulation and visualization.
The former is the de facto way of doing data manipulation and analysis in Python. Its name is derived from “panel data,” and not from the animal we all know and love. All jokes aside, Pandas is not only easy to get into thanks to its excellent documentation but is also well-integrated with many other Python libraries for data, AI, and visualization. The main draw of Pandas is the data structures and functions it offers for manipulating tables and time series.
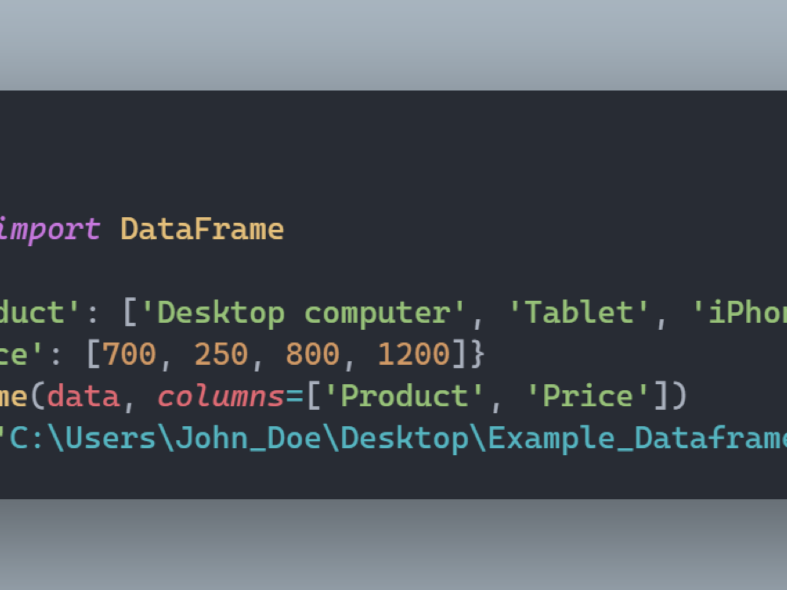
Pandas works with DataFrame objects, two-dimensional tabular data with labelled axes. It is also highly compatible with the most used data file formats, such as csv and json, making it possible to read data from and convert DataFrames to those formats.
An example of how to create a DataFrame and save it as a json file can be found below:
Meanwhile, Dash is an incredibly simple and useful open-source visualization tool. It is developed by Plotly, a Canadian company that produces data visualization frameworks available in a wide spectrum of languages, such as Python, R, Julia, etc.
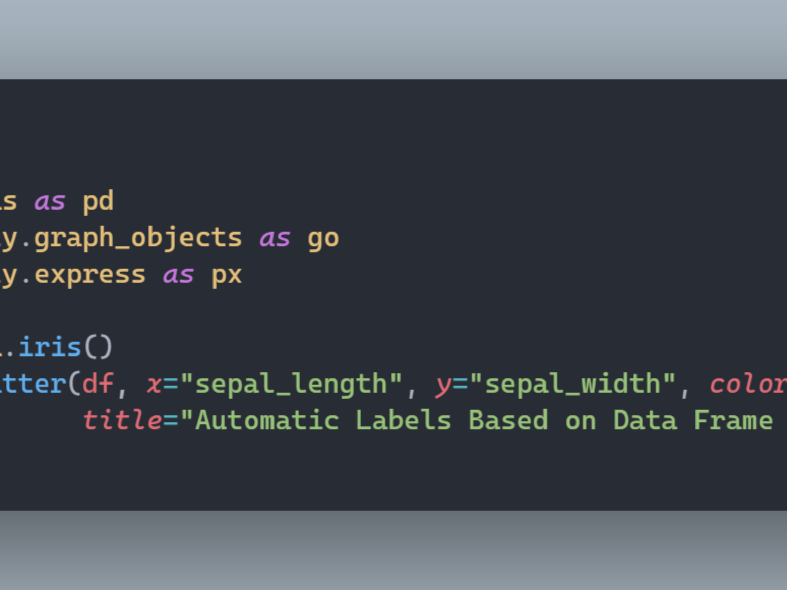
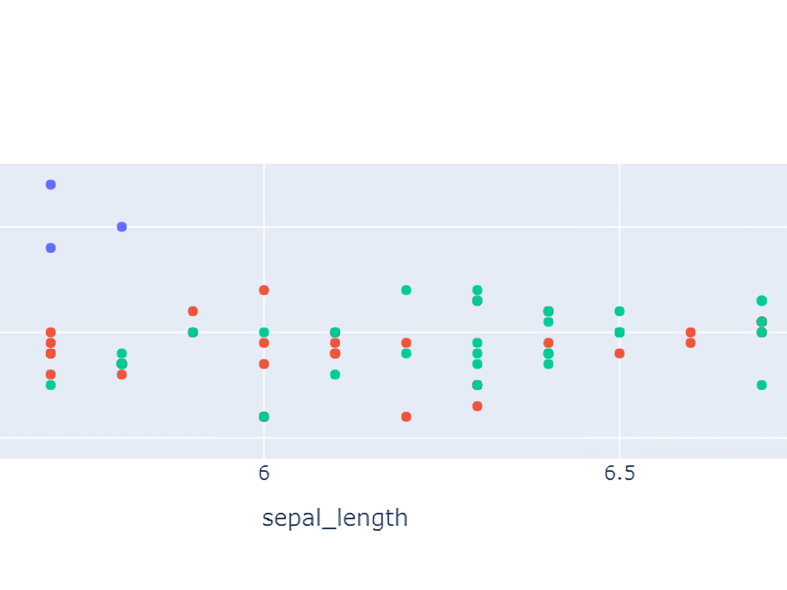
Dash provides the necessary tools to develop frontend visualizations and web applications without requiring much web development knowledge. With just a couple of lines of code, it is possible to obtain good-looking interactive plots with wide customisation capabilities. The Python version of Dash is also compatible with many of the main Python data libraries, such as Pandas and NumPy, as well as default Python datatypes.
Dash expands web data visualization to a wider spectrum than just front-end developers, offering a simple and friendly framework to coders specialized in other areas.
Throughout this journey, which started as a learning experience within the cloud environment, we have learned how to put cloud services to work together and build a functional cloud-native application.
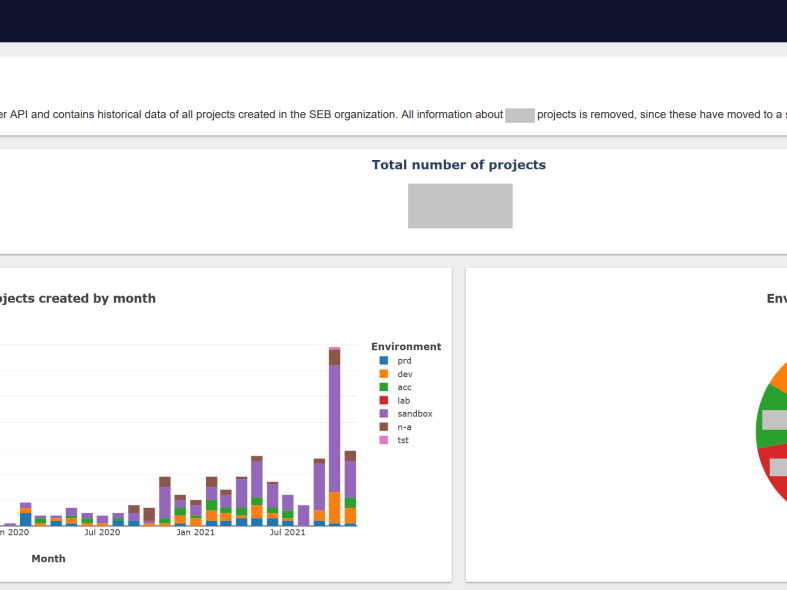
Application screenshot with some areas greyed out
The application has received a warm welcome, and this took us to think about next steps within the application context. From our most recent addition, the carbon data footprint, it is possible to see that the application is in constant evolution, and next steps will be taken, such as implementing features like predictive analysis of the KPIs.
We will keep you informed about our progress in future blog posts. Stay tuned!


